
The cleveland browns vs denver broncos match player stats highlight a high-volume passing performance, explosive scoring plays, and game-deciding turnovers that shaped the final result. Cleveland generated significant offensive yardage through the air, while Denver capitalized on defensive takeaways and situational execution to secure the win. The statistical contrast between total yards and turnover margin explains how the outcome unfolded.
A close review of the cleveland browns vs denver broncos match player stats shows how efficiency outweighed volume. Individual quarterback numbers, red-zone execution, defensive touchdowns, and late-game adjustments all played measurable roles in determining momentum. Breaking down these figures provides a clear picture of performance, risk management, and tactical decisions on both sides.
Game Overview and Final Score Summary
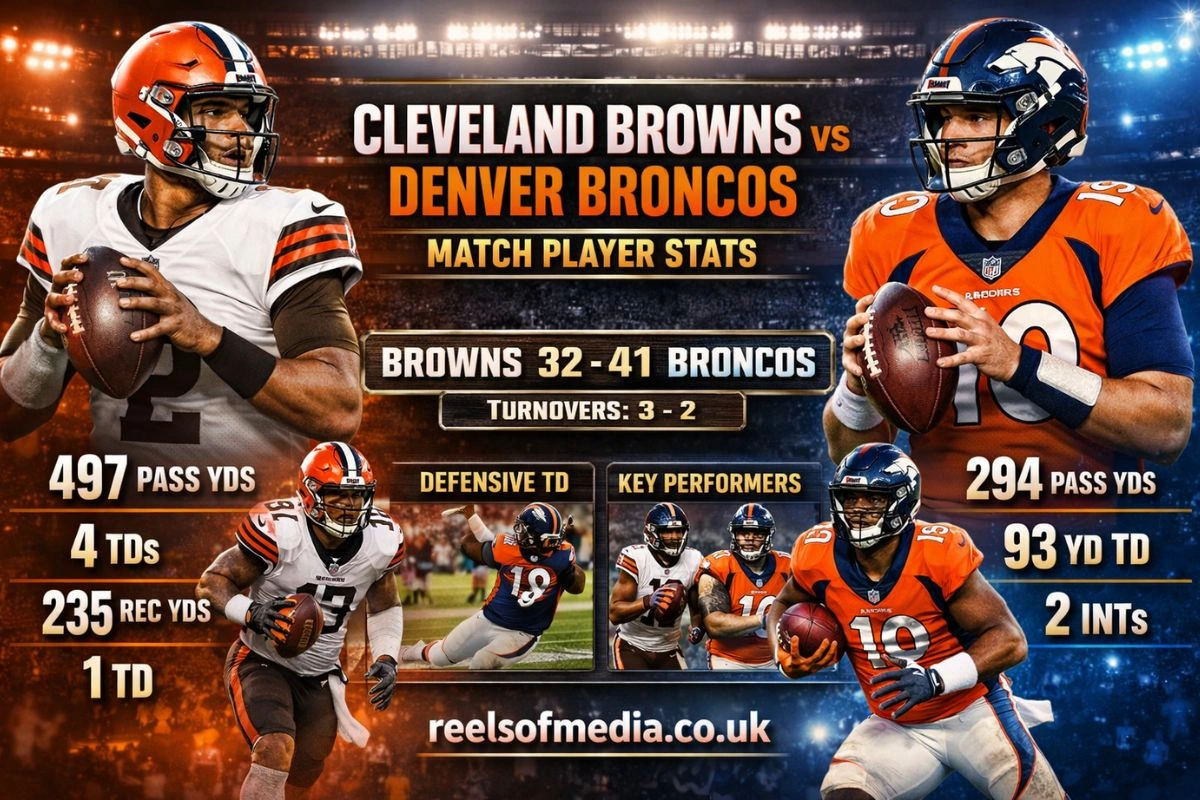
The Denver Broncos defeated the Cleveland Browns 41–32 in a high-scoring regular season matchup. The game was driven by explosive passing plays, multiple turnovers, and two defensive touchdowns that shifted momentum late.
-
Final score reflected offensive production on both sides
-
Turnovers directly influenced the outcome
-
Defensive scoring proved decisive in the fourth quarter
Final Score and Winning Team
The Broncos won 41–32 after capitalizing on late interceptions. Cleveland outgained Denver in total yards but lost the turnover battle.
-
Denver: 41 points, including defensive scores
-
Cleveland: 32 points, strong passing output
-
Turnover margin favored Denver


Date, Venue, and Attendance
The game was played on December 2, 2024, at Empower Field at Mile High in Denver. Attendance was near capacity.
-
Prime-time national broadcast
-
Home-field advantage for Denver
-
Cold-weather conditions typical for late-season games
Quarter-by-Quarter Score Breakdown
Denver closed stronger in the second half. The fourth quarter determined the result.
-
Q1: Both teams traded touchdowns
-
Q2: Cleveland gained a narrow lead
-
Q3: Offensive shootout continued
-
Q4: Broncos scored defensive touchdown to seal game
Key Turning Points in the Game
Two late interceptions returned for touchdowns changed the outcome. Cleveland’s aggressive passing approach increased risk exposure.
-
Pick-six in the fourth quarter
-
Critical third-down stop by Denver defense
-
Failed late comeback attempt by Cleveland
Cleveland Browns Offensive Player Stats
Cleveland generated over 500 total yards through an aggressive aerial attack. The passing game dominated their offensive strategy.
-
Heavy shotgun formations
-
High pass attempt volume
-
Limited reliance on sustained rushing drives
Quarterback Passing Performance
The Browns quarterback threw for nearly 500 yards with multiple touchdowns but also committed costly interceptions.
-
Over 40 pass attempts
-
4 passing touchdowns
-
3 interceptions, including one returned for a score
Leading Rushers and Ground Game Impact
Cleveland’s rushing attack was secondary to the passing game. Yards per carry were moderate.
-
Lead back averaged under 5 yards per carry
-
Limited red-zone rushing attempts
-
Ground game used mainly for balance
Top Receivers and Target Distribution
The primary wide receiver recorded over 200 receiving yards. Targets were concentrated among top playmakers.
-
9+ receptions by leading receiver
-
Multiple explosive gains over 20 yards
-
Tight end involved in red-zone packages
Red Zone Efficiency and Third-Down Conversions
Cleveland converted red-zone trips into touchdowns but struggled in late-game situations.
-
Strong red-zone touchdown rate
-
Mixed third-down efficiency
-
Late turnover on key drive
Denver Broncos Offensive Player Stats
Denver’s offense was efficient rather than high-volume. They relied on balance and capitalized on short fields.
-
Controlled tempo in second half
-
Balanced pass-run split
-
Took advantage of turnovers
Quarterback Passing Analysis
The Broncos quarterback threw for under 300 yards with one touchdown and two interceptions.
-
Moderate completion rate
-
Effective deep-ball execution
-
Managed game after defensive scores
Rushing Leaders and Yards Per Carry
Denver’s run game supported clock management late in the game.
-
Lead back averaged solid yards per carry
-
Used inside zone and power concepts
-
Key first downs in fourth quarter
Receiving Leaders and Big Plays
A long touchdown reception highlighted Denver’s explosive capability.
-
One 90+ yard scoring play
-
Slot receiver active in short-yardage routes
-
Play-action created mismatches
Offensive Line Protection and Sack Data
Denver’s line allowed limited pressure compared to Cleveland.
-
Minimal sacks allowed
-
Effective pass protection in second half
-
Controlled defensive blitz packages
Defensive Player Stats and Impact Plays
Defensive scoring determined the final margin. Both teams generated pressure, but Denver converted opportunities.
-
Multiple interceptions recorded
-
Quarterback hits influenced passing rhythm
-
Defensive touchdown decisive
Total Tackles and Defensive Leaders
Linebackers led total tackles for both teams.
-
Double-digit tackles by leading defender
-
Strong pursuit angles
-
Limited missed tackles in open field
Sacks, Pressures, and Quarterback Hits
Both defenses applied pressure, though Cleveland allowed more disruptive plays.
-
Multiple QB hits recorded
-
Edge rushers active on third downs
-
Pressure led to hurried throws
Interceptions and Turnovers Forced
Denver forced three interceptions. Cleveland forced two turnovers in response.
-
Two fourth-quarter interceptions by Denver
-
One turnover led directly to points
-
Turnover margin favored Broncos
Defensive Touchdowns and Game-Changing Plays
A late pick-six sealed the game.
-
Interception returned for touchdown
-
Defensive score shifted win probability
-
Momentum permanently changed in final minutes
Special Teams Performance Analysis
Special teams played a stabilizing role without major errors.
-
Clean field goal execution
-
Controlled return coverage
-
No blocked kicks
Field Goals and Extra Points
Both kickers converted routine attempts.
-
100% extra point success
-
No missed short-range kicks
-
Reliable snap-hold operation
Punt and Kick Return Stats
Return units focused on ball security.
-
No fumbles on returns
-
Limited explosive returns
-
Average starting field position maintained
Punting Average and Field Position Impact
Punting maintained field position discipline.
-
Solid net average
-
Effective directional punting
-
Reduced return yardage allowed
Team Comparison: Browns vs Broncos Statistical Breakdown
Cleveland led in yardage, but Denver led in efficiency and turnover control.
-
Browns: Higher total offense
-
Broncos: Better situational execution
-
Turnovers decisive
Total Yards and Time of Possession
Cleveland outgained Denver significantly.
-
Over 550 total yards for Cleveland
-
Balanced but lower yardage for Denver
-
Time of possession relatively even
Turnover Margin Comparison
Turnovers defined the outcome.
-
Denver: +1 turnover margin
-
Cleveland: Multiple high-impact interceptions
-
Defensive scores amplified difference
Penalties and Discipline Metrics
Penalties were not a primary factor.
-
Moderate penalty yard totals
-
No critical late-game flags
-
Discipline remained stable
Third-Down and Fourth-Down Efficiency
Denver executed better in key situations.
-
Higher late-game third-down conversion rate
-
Conservative fourth-down decisions
-
Situational awareness advantage
Key Player Matchups That Defined the Game
Individual matchups influenced momentum swings.
-
Secondary coverage tested frequently
-
Edge rushers pressured pocket
-
Receivers won contested catches
Quarterback vs Defensive Secondary
The Browns quarterback challenged Denver’s secondary aggressively.
-
Deep attempts increased interception risk
-
Secondary adjusted coverage in fourth quarter
-
Defensive backs capitalized on mistakes
Wide Receivers vs Cornerbacks
Top receivers won early but were contained late.
-
High yardage totals
-
Tight coverage in red zone
-
Turnover resulted from contested throw
Pass Rush vs Offensive Line Battle
Denver’s pass rush generated late pressure.
-
Timed blitzes disrupted rhythm
-
Cleveland line fatigued late
-
Critical sack influenced drive outcome
Advanced Analytics and Efficiency Metrics
Advanced metrics show efficiency outweighed volume.
-
EPA favored Denver late
-
Explosive plays defined scoring
-
Snap distribution showed pass-heavy approach
Yards Per Play and EPA Analysis
Cleveland averaged higher yards per play.
-
High passing EPA early
-
Negative EPA from interceptions
-
Defensive EPA swing in fourth quarter
Completion Percentage Over Expectation (CPOE)
Quarterback accuracy varied under pressure.
-
Positive CPOE in first half
-
Decline under blitz
-
Defensive disguise impacted reads
Explosive Play Rate Comparison
Both teams produced explosive gains.
-
20+ yard passes frequent
-
One 90+ yard touchdown by Denver
-
Explosive plays drove scoring
Player Snap Counts and Usage Rates
Star players logged high snap percentages.
-
Heavy offensive snaps for starting QB
-
Defensive starters played majority of snaps
-
Rotational backs used situationally
Injuries and Their Impact on Player Performance
Injuries were limited but depth adjustments occurred.
-
Minor in-game substitutions
-
No season-ending injuries reported
-
Rotational shifts on defense
In-Game Injuries and Replacements
Short-term injuries required substitutions.
-
Backup defensive backs rotated in
-
Offensive skill positions remained intact
-
No major structural changes
Key Players Missing Before Kickoff
Pre-game absences impacted rotation depth.
-
Adjusted defensive assignments
-
Backup contributors elevated
-
Reduced substitution flexibility
Depth Chart Adjustments
Coaches adjusted based on availability.
-
Increased snap load for starters
-
Situational defensive packages
-
Limited offensive rotation
Coaching Decisions and Strategic Adjustments
Coaching risk tolerance affected outcomes.
-
Aggressive passing approach by Cleveland
-
Conservative late-game management by Denver
-
Defensive adjustments critical
Play Calling Trends
Cleveland favored vertical passing.
-
High early down pass rate
-
Spread formations dominant
-
Limited run commitment
Fourth-Down and Two-Point Attempts
Coaches avoided excessive risk.
-
Standard PAT usage
-
Limited fourth-down gambles
-
Field position prioritized
Halftime Adjustments and Momentum Shifts
Denver adjusted coverage schemes after halftime.
-
Increased safety help over top
-
More disguised blitz packages
-
Reduced explosive plays allowed
Historical Context of Browns vs Broncos Matchups
The rivalry has featured several high-scoring games historically.
-
Competitive head-to-head record
-
Past playoff implications
-
Memorable quarterback duels
Head-to-Head Record
Denver historically holds a slight edge.
-
Multiple postseason meetings
-
Close margin victories
-
Balanced offensive trends
Previous High-Scoring Encounters
Several past meetings exceeded 30 points per team.
-
Offensive shootouts common
-
Quarterback-centric games
-
Late-game dramatics typical
Notable Player Performances in Past Meetings
Individual standout performances shaped rivalry history.
-
Record-setting passing games
-
Defensive takeaways in clutch moments
-
Special teams returns impacting outcomes
How This Game Impacts Season Standings
The result influenced playoff positioning and divisional leverage.
-
Denver improved conference standing
-
Cleveland faced increased pressure
-
Tiebreaker implications relevant
Division Ranking Implications
Denver strengthened its position within its division.
-
Improved win-loss record
-
Advantage in AFC standings
-
Momentum entering next week
Playoff Picture Impact
Turnover-driven win helped postseason outlook.
-
Wild Card race tightened
-
Tiebreaker scenarios affected
-
Increased margin for Denver
Team Momentum Moving Forward
Denver gained confidence; Cleveland must address turnover risk.
-
Defensive confidence boost
-
Offensive evaluation required
-
Strategic recalibration likely
FAQs
Who had the best overall performance in the game?
The Browns quarterback led in total passing yards, while a Broncos defensive back delivered the most decisive play with a late interception return for a touchdown.
Which team was more efficient despite lower total yards?
Denver was more efficient because they converted turnovers into points and executed better in late-game situations.
How did turnovers influence the final result?
Turnovers directly shifted momentum. Cleveland’s interceptions resulted in defensive scores, which created a scoring gap that could not be recovered.
What do the cleveland browns vs denver broncos match player stats reveal about offensive strategy?
The cleveland browns vs denver broncos match player stats show Cleveland relied heavily on vertical passing, while Denver used balanced play-calling and capitalized on short-field opportunities created by turnovers.
Where can official player statistics be verified?
Official statistics can be verified through the NFL’s official game center, team websites, and accredited sports data platforms.